Teaching and Learning Model Building.
The three papers below called Teaching Notes describe the structure of my introductory system dynamics modeling course. But it’s more than that. It’s the best structuring of the path to becoming a modeler that I ever managed to develop. The Notes describe and illustrate the seven necessary phases in that path — Exploring existing models, Copying models, Adding structure, Correcting or improving structure, and ending with three modeling exercises increasing in difficulty: Modeling from text, Modeling a familiar problem, and Conceptualizing a personally chosen problem.
The three PPT presentations below the Notes appear at different stages of the course.
-
Model Teaching I
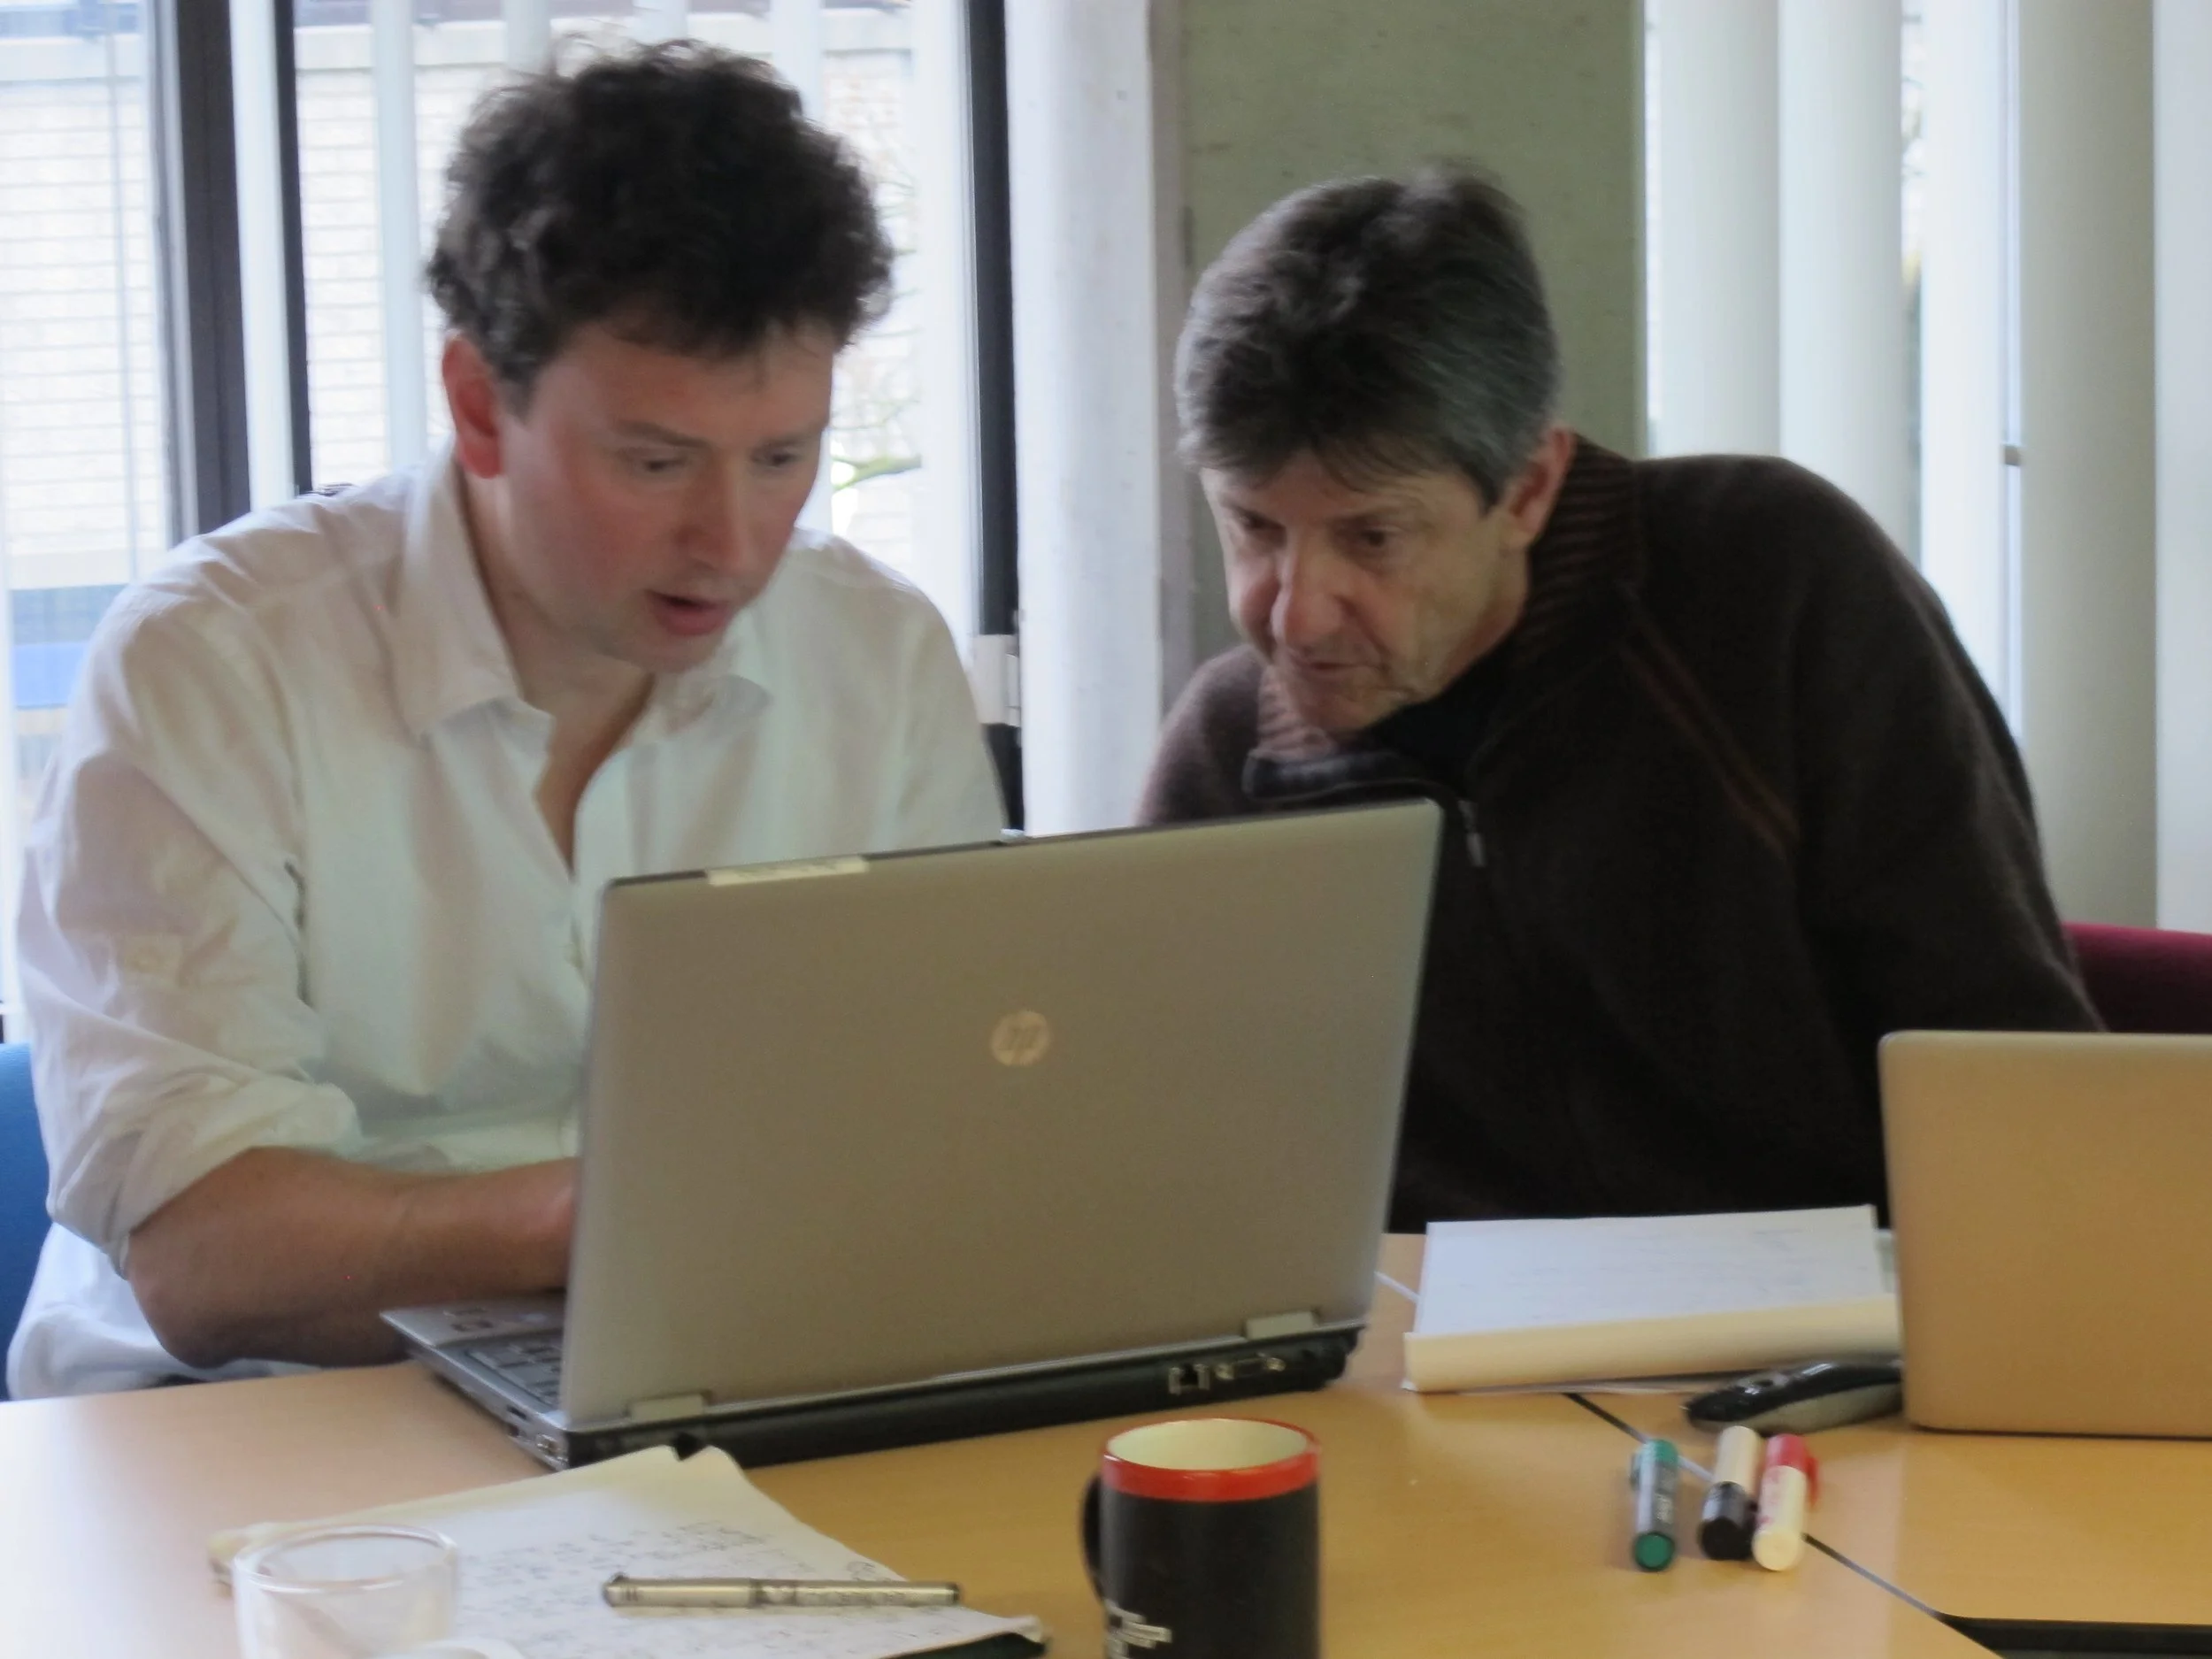
Overview of the three Teaching Notes, and descriptions of the first three classes at the University at Albany. The picture shows Etiënne and Jac at Radboud University Nijmegen.
-
Model Teaching II
Descriptions and examples of the middle four classes and exercises in the generic course outline. Exercises give less help, require more initiative and skill.
-
Model Teaching III
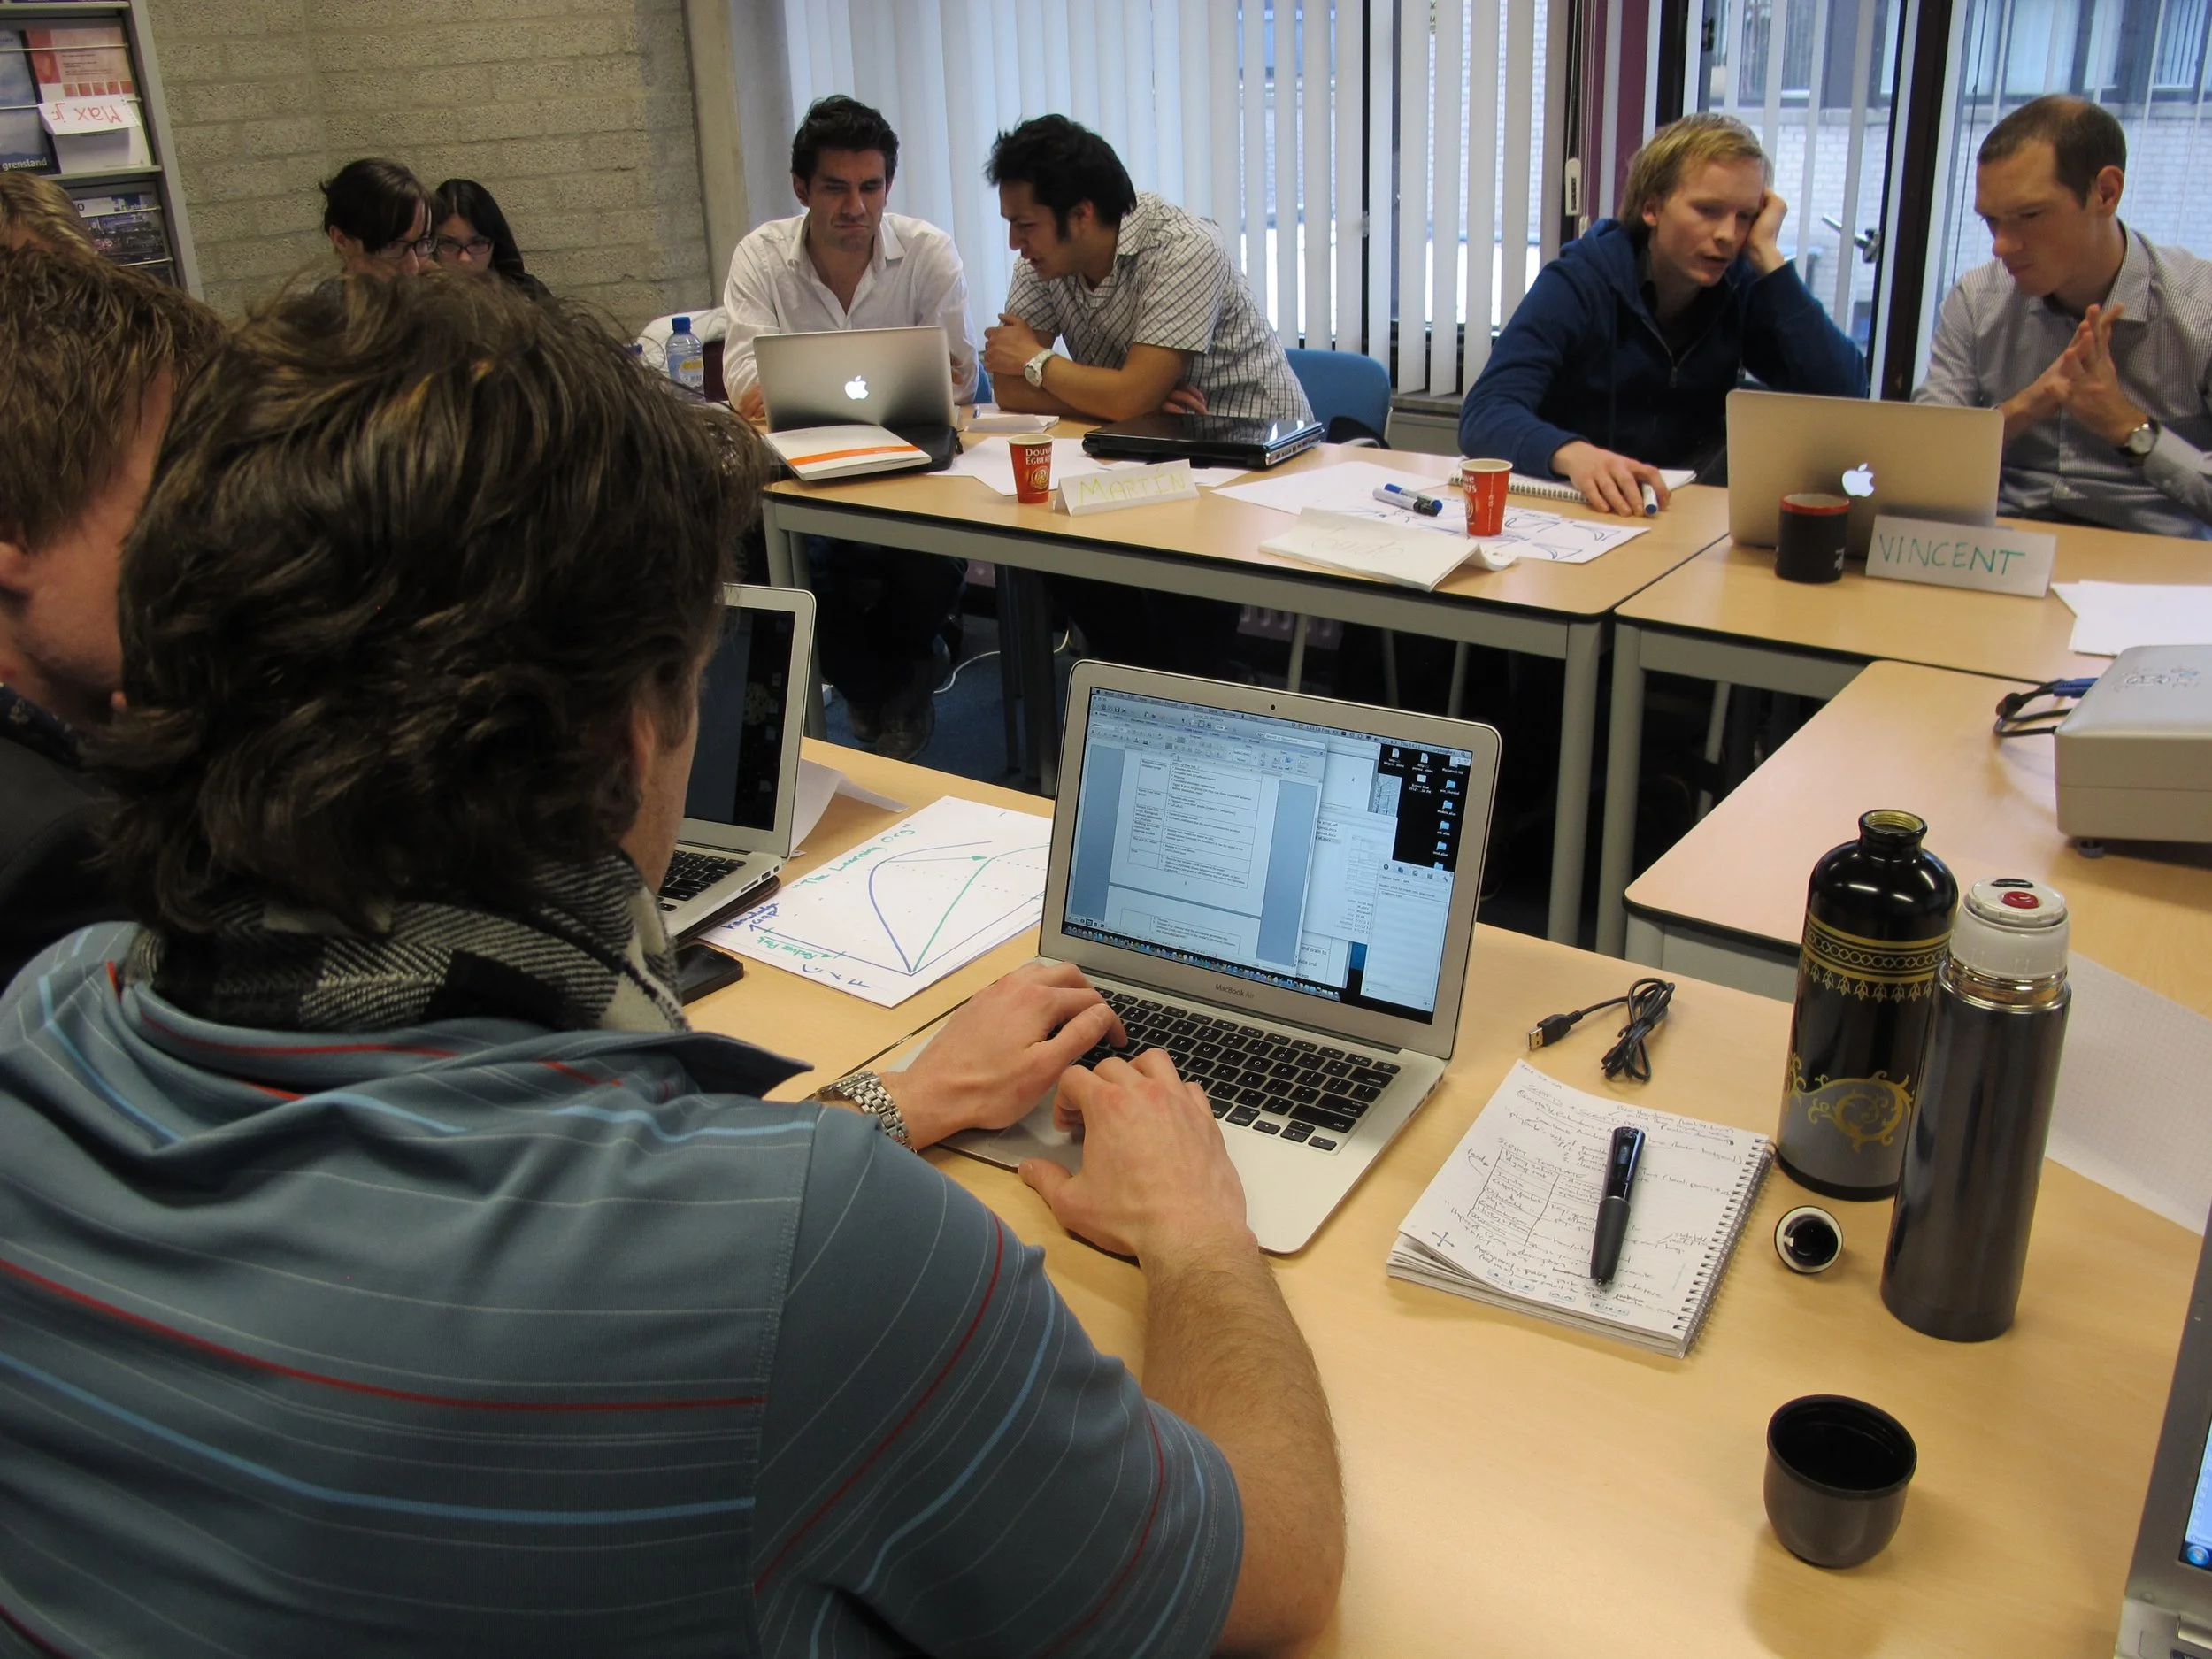
The last sections and capstone exercises in the generic course, moving toward mastery. Students here are in the European Masters Program in System Dynamics.
-
Model Conceptualization
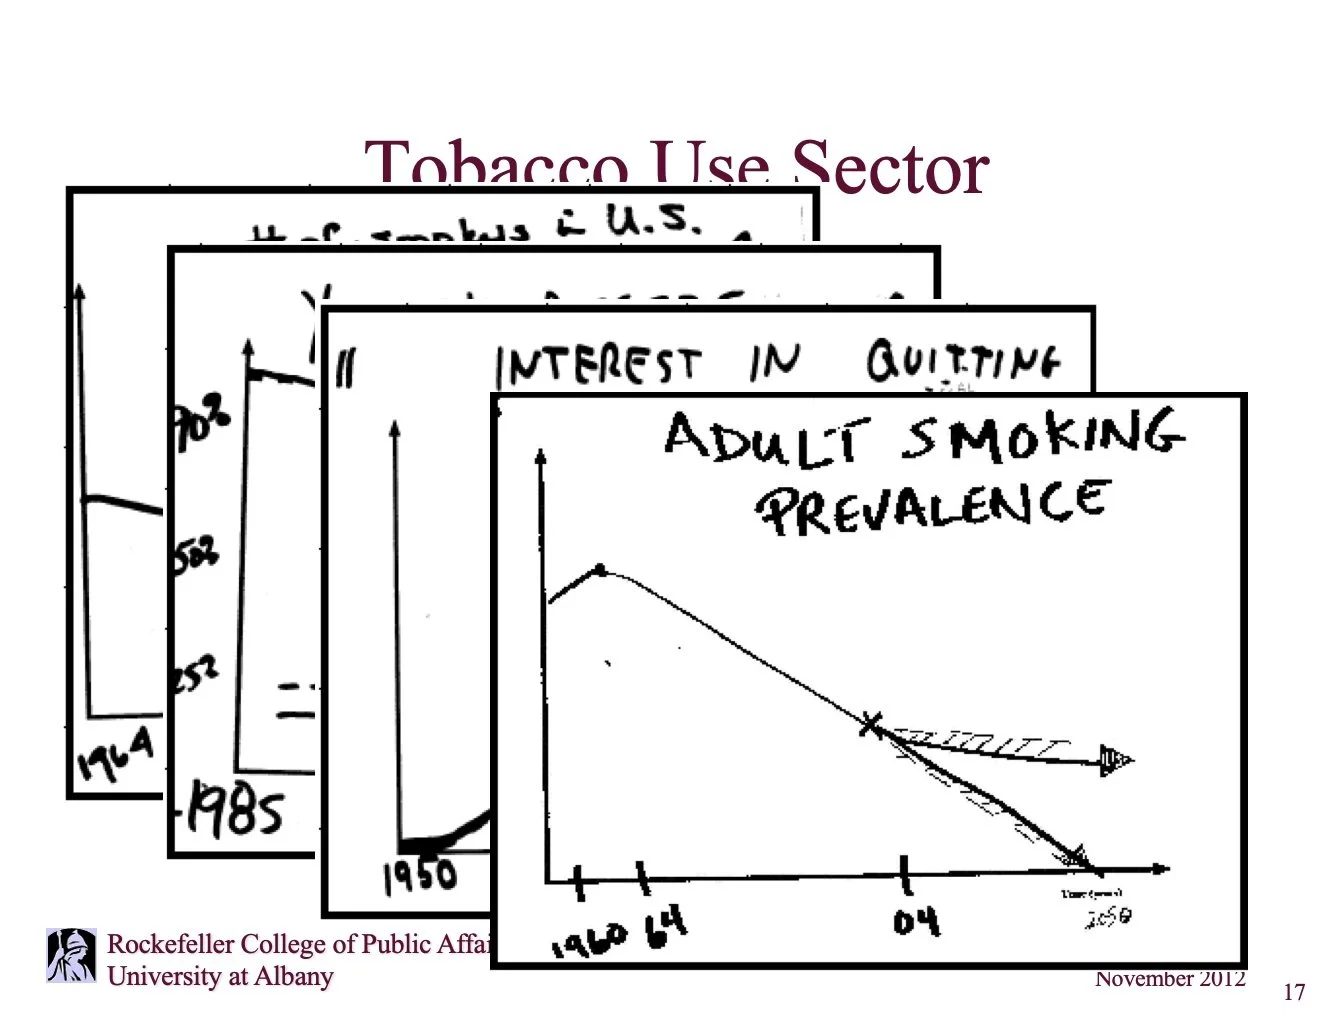
A teaching PPT showing the detailed thinking stages in the dynamics and structure of a new model.
-

Unfolding for Understanding
“Unfolding” is the step-by-step revealing sections in a map or model image. It’s the only way people can understand complex model structure.
-
GPR's last system dynamics class (2012)
A PPT reviewing what we’ve done and trying to communicate what’s really important for students’ future work.
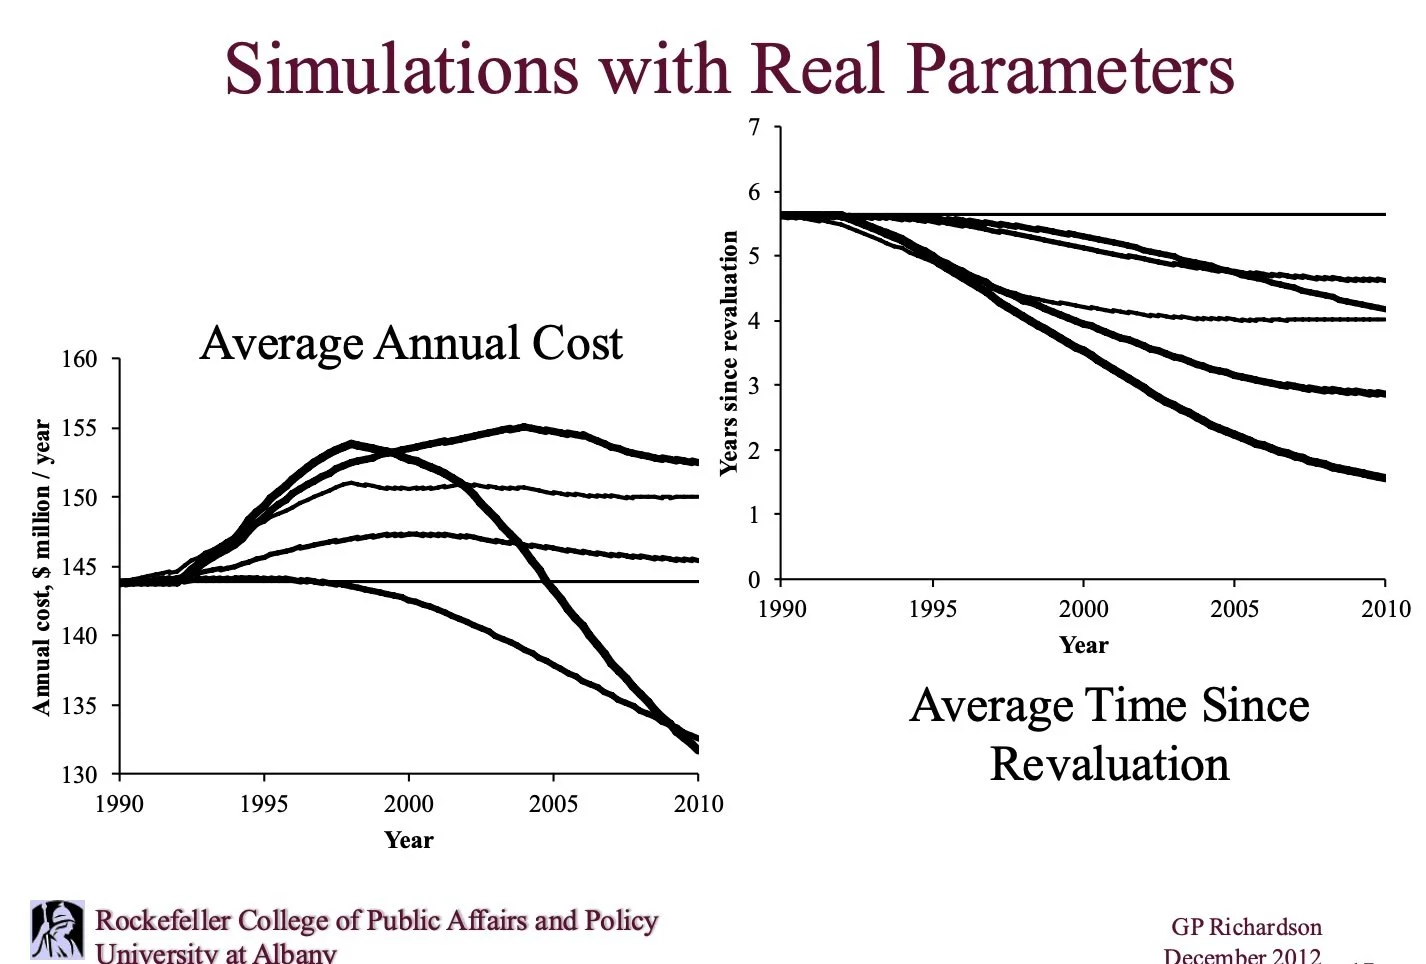
The Attempt to Control a System Generates Dynamics of its Own
Here’s where we went wrong.
The Endogenous Point of View
The concept of endogenous change is fundamental to the system dynamics approach. It has both philosophical and engineering origins. A deep and lasting insight of the earliest attempts at servomechanisms control is the realization that the act of trying to govern / manage / control generates system dynamics of its own, complicating the dynamics trying to be controlled.